
Introduction
- The government's prudent fiscal management has strengthened credibility and reinforced confidence in India's macroeconomic and fiscal framework.
- This led to three sovereign credit rating upgrades in 2025 by Morningstar DBRS, S&P Global Ratings, and Rating and Investment Information (R&I), Inc.
Chapter Precap
Central Government Finances
| Overview of State Government Finances
|
Debt Profile of the Government
| General Government Finances
|
Central Government Finances
Fiscal policy as a key anchor of macroeconomic stability and confidence
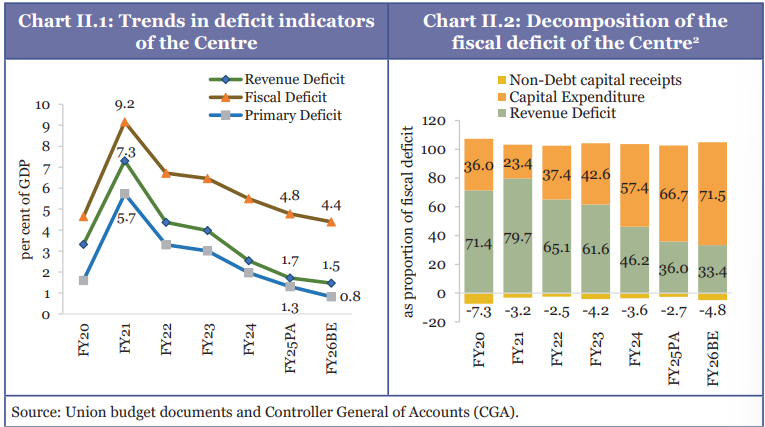
- Fiscal deficit: It declined from 9.2% of GDP in FY21 to 4.8% of GDP in FY25 (Provisional Accounts, (PA)) and is budgeted at 4.4% of GDP in FY26.
- Revenue deficit: Over the same period, revenue deficit as a proportion of GDP has narrowed steadily, reaching its lowest level since FY09, thereby leaving a greater allocation for capex (Capital Expenditure).
- Primary deficit: Decline in primary deficit-to-GDP ratio indicates that fresh borrowings are increasingly being used to service past interest obligations rather than to finance current spending.
Sustained revenue buoyancy supports consolidation
- Revenue receipts: It increased to around 9.1% of GDP in post-pandemic period (FY22-FY25 PA).
- This improvement was driven primarily by higher gross tax revenue, which rose to about 11.5% of GDP.
- Robust growth momentum of domestic economy and combined effects of government's tax policy and tax administration changes are reflected in buoyancy of revenues.
Broadening of the Direct Tax Base
- Share of direct taxes in total taxes: It has increased to 55.5% in FY22-FY25 years, reaching 58.8% in FY25 (PA).
- Total taxes include direct (Corporate tax + Taxes on income other than Corporate tax i.e. Non-corporate tax) and indirect taxes (i.e. Corporate tax+ Non-corporate tax + Customs+ Excise+ GST + Service tax).
- Among components of direct taxes, non-corporate tax collections increased to around 3.3% of GDP in post-pandemic period.
- Nudge-based interventions have emerged as a powerful tool for improving tax compliance and enhancing the efficiency of tax administration in India.
- NUDGE (Non-intrusive Usage of Data to Guide and Enable) approach, adopted by the Income Tax Department, uses behavioural economics to encourage voluntary tax compliance through timely information, gentle prompts, and data-driven insights instead of coercive enforcement.
- It leverages large-scale data analytics to identify potential non-compliance and enables taxpayers to voluntarily correct or update their filings without audits or litigation. For instance,
- Foreign Asset Campaign led nearly 25,000 taxpayers to revise returns, with 61% positive response, declaring foreign assets worth over ₹29,000 crore and foreign income exceeding ₹1,000 crore.
- Targeted nudges reduced incorrect HRA claims, yielding ₹119 crore in extra tax.
- Data-driven nudges improved third-party reporting and accuracy in TDS filings. Over 8,500 deductors revised TDS returns, adding 1.08 crore deductees and bringing ₹4,825 crore in additional TDS into system.
Excise and Customs Duties: Supporting growth through rate rationalisation
- Indirect taxes: Excise duty collections moderated in FY22-FY25 period, declining from about 1.7% of GDP in FY22 to around 0.9% of GDP in FY25.
- This moderation was driven by reductions in excise duty rates on petroleum products in 2021 and 2022, along with relatively moderate growth in petrol and diesel consumption during FY24 and FY25.
- Excise duty collections: They witnessed a growth of 9.3% on a YoY basis.
- Customs collections: They have reduced by 7.3% on a YoY basis.
Goods and Services Tax: Revenue stability amid ongoing reform
- Gross GST revenue: During April-December 2025 it stood at ₹17.4 lakh crore, recording a YoY growth of 6.7%.
- e-way bill volumes: During April-December 2025, it grew by 21% YoY.
- Recent rationalisation of GST rates is expected to support demand by lowering tax incidence and improving price competitiveness.
- Since the lower rates are expected to stimulate higher consumption volumes and strengthen compliance, volume effects could offset the impact of rate reductions on revenues.
- 56th meeting of the GST Council has Simplified rates i.e. Standard rate of 18%, Merit rate of 5%, and special de-merit or sin-good rate of 40% for a select few goods and services (no net tax hike).
- Rationalisation of GST (GST 2.0 effective from September 2025) marked as third pillar of tax reforms, following the corporate tax reductions of 2019 and personal income tax reforms w.e.f. April 2025.
Key Changes introduced in GST 2.0 | |||
| Category | Items Covered | GST Rate Change | |
| Agriculture and related items | Agricultural goods (tractors, agricultural, horticultural or forestry machinery etc.) | Reduced to 5% from 12% | |
Fertiliser inputs such as Sulphuric acid, Nitric acid and Ammonia | Reduced to 5% from 18% | ||
| Auto & Auto Parts | Small cars, motorcycles (350cc & below), three-wheelers, buses, trucks and ambulances | Reduced to 18% from 28% | |
All auto parts irrespective of their HS code. | Uniform 18% | ||
Motorcycles (>350cc) and cars outside small cars definition | Shifted to 40% slab; Cess on luxury cars removed | ||
| Electronic Appliances | ACs, TVs (larger than 32 inches), dishwashing machines, monitors and projectors | Reduced to 18% from 28% | |
| Textile & Labour Intensive Goods | Man-made fibres | Reduced to 5% from 18% | |
Man-made yarn | Reduced to 5% from 12% | ||
Labour-intensive goods such as handicrafts, marble and intermediate leather goods | Reduced to 5% from 12% | ||
| Everyday essentials & food | Hair oil, toilet soap bars, shampoos, toothbrushes, toothpaste, bicycles, tableware, kitchenware and other household articles | Reduced to 5% from earlier 12% or 18% | |
Ultra-High Temperature (UHT) milk, all Indian breads, and pre-packaged and labelled paneer | Zero GST | ||
All items such as packaged namkeens, instant noodles, chocolates, coffee, preserved meat, butter, ghee, etc. | Reduced to 5% from earlier 12% or 18% | ||
| Medicines & Medical Equipment | Select lifesaving drugs & medicines | Zero GST | |
All other drugs & medicines | Reduced to 5% from 12% | ||
Medical apparatus & devices and Medical equipment and supplies. | 5% GST | ||
| Hotel & Personal Services | Hotel accommodation services (value less than or equal to ₹7,500 per unit per day) | Reduced to 5% from 12% | |
Beauty and physical well-being services (gyms, salons, barbers, yoga centres, etc.) | Reduced to 5% from 18% | ||
| Insurance Policies | All individual life and health insurance policies as well as to reinsurance of these individual policies | GST exempted | |
Non-tax revenues buoyed by rising dividends and profits
- Non-tax revenues of Centre, as a percentage of GDP: They have broadly remained stable at around 1.4% of GDP in FY22-FY25 period, thereby providing steady support to Centre's revenue receipts.
- This stability has been largely supported by surge in dividends and profits.
- The increase reflects higher surplus transfers from RBI, along with improved financial performance of public sector banks and financial institutions.
- Improved performance of Central Public Sector Enterprises (CPSEs) has contributed to growth in Centre's non-tax revenues.
- Between FY20- FY25, gross turnover per CPSE increased by approximately 32%, reflecting operational efficiency and effective capital management of PSUs.
Non-debt capital receipts
- Receipts from asset and equity monetisation are an important component of Government's non-debt capital receipts.
- Strategic disinvestment has progressed in a calibrated manner over recent years.
- Since 2016, in-principle approval has been accorded for strategic disinvestment for 36 CPSEs, of which 13 transactions have been completed, with the remainder at various stages of implementation.
- Receipts from equity monetisation can be strengthened by selectively reducing Government equity in certain CPSEs beyond the minimum public shareholding norms, guided by market conditions and enterprise-specific factors.
- Minimum public shareholding norms says that at least 25% of shares in a listed company have to be held by public shareholders.
Trends in expenditure
Continued rationalisation in revenue expenditure
- Revenue expenditure: It has moderated from 13.6% of GDP in FY22 to 10.9% in FY25, thereby creating space for more productive capital expenditure.
- Large share of revenue expenditure (covering salaries, pensions, interest payments, and defence) is committed in nature, highlighting the importance of rationalising discretionary spending, particularly subsidies, to create fiscal space.
- Expenditure on major subsidies: It declined to 1.2% in FY25 and is budgeted at 1.1% of GDP in FY26.
- Interest payments: They increased to around 3.4% of GDP in FY22-FY25 period, reflecting higher borrowing undertaken to support economic recovery during pandemic.
Tech-driven solutions for improving efficiency in public expendituresJust-in-Time (JIT) fund release reform
Tech-driven solutions in the Public Distribution System (PDS) supply chain
|
Capital expenditure
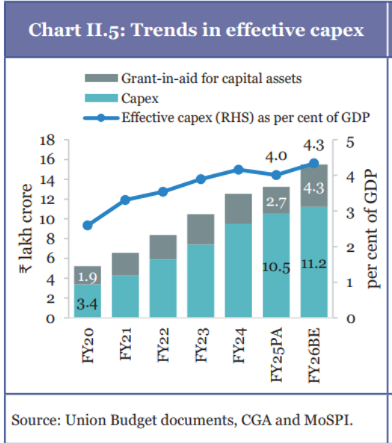
- Effective capital expenditure of Central government along with grants-in-aid for creation of capital assets rose to about 3.9% in FY22-FY25, and further to 4% of GDP in FY25 (PA).
- Road transport and highways, along with railways, continued to account for over half of total capital expenditure through FY25 (PA).
- Allocations towards transfers to States, telecommunications, and housing and urban affairs recorded robust double- digit growth, leading to a higher share for these sectors in overall capex.
Trends in expenditure in FY26
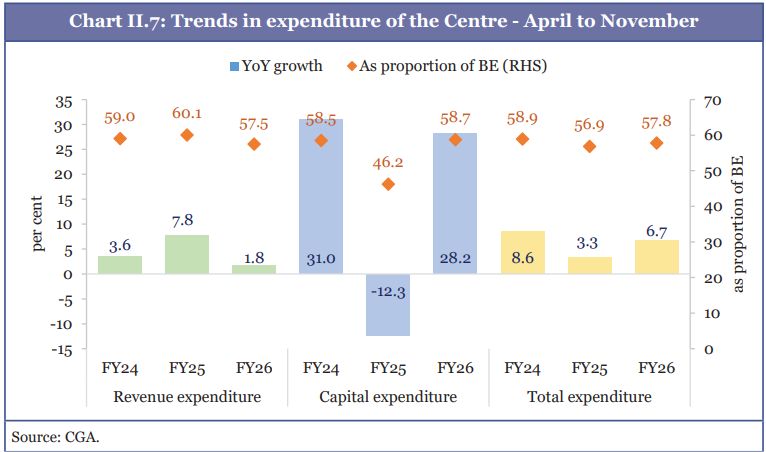
- Capital expenditure: It rebounded strongly in current fiscal year, rising by 28% YoY (April- November 2025) and reaching nearly 59% of budgeted allocation, broadly in line with FY24 trends.
- In contrast, revenue expenditure grew by just 1.8% (April- Nov 2025), underscoring the government's continued commitment to fiscal consolidation.
- Revenue deficit: As of November 2025, revenue deficit has reached 68.2% of budget estimate for FY26, while fiscal deficit stands at 62.3% of estimated figures, indicating that Central Government is on track to achieve its budgeted deficit target for the year.
Overview of State Government Finances
Expanding Centre-State transfers through tax devolution and Finance Commission grants
- Transfer of funds from Centre to the States comprises share of States in Central taxes devolved to States, Finance Commission Grants, Centrally Sponsored Schemes (CSS), and other transfers.
- The total transfer of resources from Centre to the States has increased significantly in recent years.
Finance Commission grants
- For FY26, Fifteenth Finance Commission (XV-FC) has recommended ₹1,47,827 crore as grants-in-aid to States under Article 275 of the Constitution.
- These grants comprise post-devolution revenue deficit grants, grants to local bodies (including health sector grants), and disaster management grant.
Enhanced borrowing limits for the States
- XV-FC has recommended a Net Borrowing Ceiling (NBC) of 3% of GSDP (Gross State Domestic Product) for States in FY26.
- In addition, States may avail performance-linked additional borrowing of up to 0.5% of GSDP for power sector, over and above the normal borrowing ceiling.
- States are permitted to borrow over and above their normal borrowing limits by an amount equal to the pension contributions (both employer's and employees') that they deposit under National Pension System (NPS) with the designated authority (NSDL or the trustee bank).
Performance of State Finances
Increasing revenue and fiscal deficit while capex remains intact
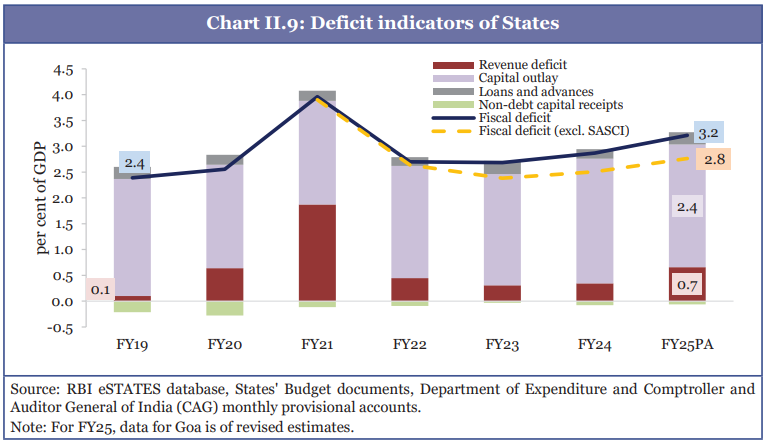
- Combined fiscal deficit of State Governments: It remained broadly stable at around 2.8% of GDP in FY22-FY25 period, but has edged up in recent years to 3.2% in FY25, reflecting emerging pressures on State finances.
- Between FY19 and FY25PA, 18 States saw a deterioration in their revenue balances, of which-
- 10 slipped into revenue deficit from revenue surplus, 5 worsened their revenue deficit and 3 managed to stay in revenue surplus despite deterioration.
- States derive most of their revenues from their own tax sources.
- Share of States' own tax revenue in total revenue receipts increased to about 50% in FY25 (PA).
- States' share in central taxes constituted the second-largest source, at around 32%, followed by grants-in-aid and non-tax revenues.
- Total revenue receipts of States, as a percentage of GDP: It declined to 12.2% in FY25 (PA), thereby constraining fiscal space at combined State level.
- Through Special Assistance to States for Capital Expenditure (SASCI), Centre has incentivised States to maintain capital spending at around 2.4% of GDP in FY25.
- Introduced in October 2020, SASCI scheme provides 50-year interest-free loans to support State capital expenditure, recognising its high multiplier effects and ability to crowd in private investment.
- SASCI has played a stabilising role in sustaining State capital expenditure amid pressures on the revenue account.
- Overall capital outlay of States increased from 2.17% of GDP in FY22 to 2.37% in FY25 (PA). However, excluding SASCI-linked capital spending, States' capex declined from 2.11% to 1.92% of GDP over the same period.
- Therefore, SASCI helped States to avoid a pro-cyclical compression of public investment.
- States with lower per capita incomes have relied more heavily on SASCI to finance capital outlay, reaffirming its role in supporting fiscally constrained States to achieve convergence with the high-income states.
- By sustaining investment and incentivising reforms, SASCI strengthens productive capacity, enhances future revenue potential, and supports medium-term fiscal health.
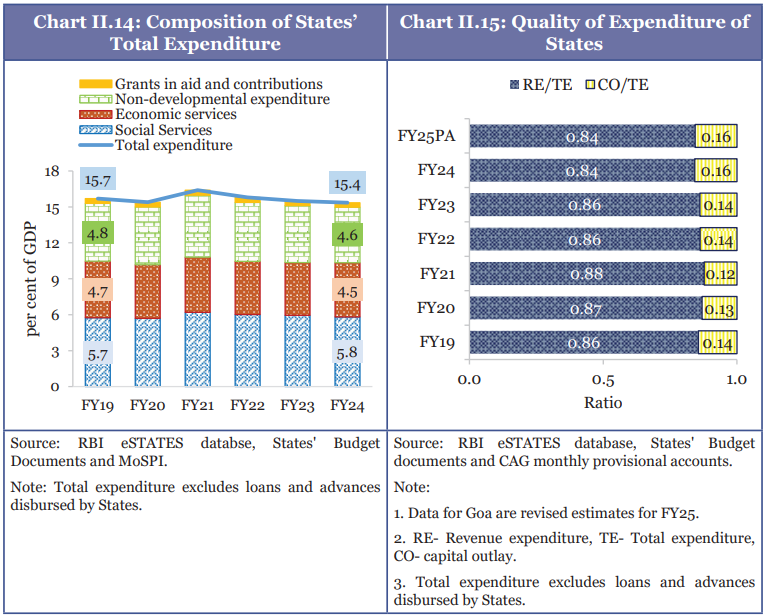
- On expenditure side,
- Total expenditure of States, as a share of GDP: It moderated marginally from 15.7% in FY19 to 15.4% in FY24.
- Revenue expenditure: It continues to account for the bulk of State spending, although its share declined modestly to 84% in FY24.
Trends in State's receipts and expenditures in FY26
- Combined revenue receipts of the states have grown at a rate of 6.6% during April- November 2025, which is lower than the YoY growth of the previous year.
- YoY increase in revenue expenditure has been contained at 7.6% in FY26 (April- November 2025), lower than the YoY growth of the previous year.
Debt Profile of the Government
Central Government Debt
- Central Government's debt management strategy is anchored in three guiding principles:
- Maintaining a low and stable cost of borrowing,
- Mitigating risks associated with maturity (rollover risk), interest rates and currency exposure, and
- Supporting the development of government securities markets.
- Since pandemic, the gradual consolidation of debt has reinforced the credibility of fiscal policy, even as global public debt levels have continued to rise.
Low Cost of Borrowing and Strategic Issuance
- Marketable securities (primarily dated securities and treasury bills) constitute about 65% of government liabilities, allowing favourable domestic conditions like easing inflation, strong growth, and supportive liquidity to translate into lower borrowing costs.
- Rollover, interest rate, and foreign currency risks contained through prudent debt management strategy-
- Rollover risk: Reduced by elongating maturities throughswitch and buyback operations, with weighted average maturity of fresh issuances around 19 years and that of outstanding dated securities rising to 13.66 years in FY25.
- Interest rate risk limited: By maintaining predominantly fixed-rate debt profile, with floating-rate debt accounting only 4.1% of outstanding debt at end-FY24, ensuring predictability of interest costs.
- Foreign currency risk remains low: Due to country's reliance on domestic currency borrowing, with external debt accounting for small share of liabilities (~2.6% of GDP), largely sourced from multilateral institutions on long-term, concessional terms, thereby insulating public debt from exchange rate and external shocks.
States' Debt
- Debt-GSDP ratio and interest payments to revenue receipts (IP/RR) ratio are key variables in assessing fiscal health of States.
- A sustainable level of debt helps promote intergenerational equity, especially when it finances investments.
- Similarly, lower IP/RR ratio allows for greater fiscal space in undertaking productive expenditure, catering to other committed expenditure and maintaining revenue balance.
- Combined debt-GSDP ratio of States and UTs has been on an increasing trajectory in the last decade.
General Government Finances
- It provides an overview of the fiscal position of the centre and states, when taken together and after netting out certain central transfers.
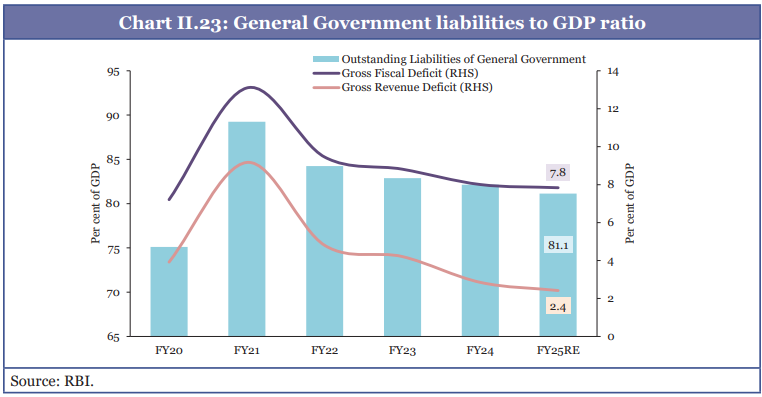
- Mirroring trends in central government debt, general government deficits and liabilities, which remained above pre-pandemic levels, have followed a consolidation path in post-pandemic period.
- India reduced its general government debt-to-GDP ratio by about 7.1 percentage points since 2020, even while maintaining high public investment.
Conclusion and Outlook
- Sixteenth Finance Commission's recommendations will be pivotal in shaping Centre–State fiscal relations by determining the scale and composition of resource transfers, and thereby affecting State-level fiscal outcomes.
- Increasing reliance by some states on unconditional cash transfer programmes raised concerns about expenditure rigidity and medium-term fiscal flexibility.
- Thus, improved targeting, periodic review, and outcome-oriented design can help mitigate fiscal rigidities.
- Strengthening the fiscal capacity of local bodies, in line with constitutional intent, can help improve expenditure efficiency and investment outcomes at the grassroots level.
- Ongoing tax reforms, including GST 2.0 and personal income tax, enhance the efficiency of tax system by simplifying structures, lower compliance costs, and broaden tax base.
- Wide use of digital systems in tax administration and public financial management will improve expenditure disbursements, and enhance fiscal transparency, thus enabling progress on medium-term debt path and strengthening macroeconomic stability.
What does the Budget say?
- New Income Tax Act, 2025 will come into effect from April 1, 2026. Simplified Income Tax Rules and redesigned forms will be notified shortly to ensure ordinary citizens can comply without difficulty.
- Tax Collected at Source (TCS) for education and medical purposes under the Liberalized Remittance Scheme (LRS) is reduced from 5% to 2%.
- Tax Deducted at Source (TDS) Reforms: Resident buyers purchasing immovable property from non-residents can now deduct tax using their PAN rather than obtaining a Tax Deduction and Collection Account Number (TAN).
- Securities Transaction Tax (STT) on Futures is raised to 0.05% (from 0.02%).
- STT on Options premium is raised to 0.15% (from 0.1%).
- For strengthening Tax Administration, budget proposed to constitute a Joint Committee of Ministry of Corporate Affairs and Central Board of Direct Taxes for incorporating the requirements of Income Computation and Disclosure Standards (ICDS) in the Indian Accounting Standards (IndAS) itself.
- Separate accounting requirement based on ICDS will be done away with from the tax year 2027-28.
Glossary
| Terms | Meanings |
| Fiscal Deficit | Difference between government's total expenditure and its total revenue (excluding money from borrowings). |
| Revenue Deficit | Occurs when a government's total income is insufficient to meet its total expenditures, excluding any borrowing or debt repayments. |
| Primary Deficit | Difference between government revenue (excluding borrowing costs) and government spending. |
| Direct Tax | Direct tax is the one levied on a person or an entity directly and is paid directly to government. E.g. Property tax, Income tax etc. |
| Indirect Tax | Tax collected by an intermediary (such as retail store) from the person who bears the ultimate economic burden of the tax (such as customer).E.g. Excise tax, Service tax etc. |
| Central Public Sector Enterprises (CPSEs) | CPSEs means a company incorporated under Companies Act, 2013 or under any previous company law, or institutions formed in pursuance of any Act of Parliament, in which not less than 51% of share capital is held by Central Government. |
| Capital Expenditure | Refers to funds that governments and corporations allocate for acquiring, improving, or maintaining tangible assets like infrastructure, buildings, and technology. |
| Revenue Expenditure | Funds spent by a business on its day-to-day operational costs, such as salaries, rent, utilities, and raw materials. |
| Revenue Receipts | Revenue receipts are incomes of the government or a business that do not create any liability and do not reduce any asset. It consists of tax revenues, non-tax revenues, State's share of Union taxes and duties and grants-in-aid from government of India. |
| Capital Receipts | Receipts that result from sale or disposal of capital assets or from long-term loans. |
