
Introduction
- In FY 2025–26, India's industrial sector showed resilience and renewed momentum despite global challenges. This was driven by a shift towards high-technology manufacturing, aligning with global trends where competitiveness depends on strategic integration into Global Value Chains. Sustained success will require stable, innovation-friendly policies to position India as a high-productivity manufacturing hub.
- Flagship initiatives such as the PLI scheme and the National Manufacturing Mission are driving industrial transformation by boosting investment, innovation, and MSME competitiveness. Institutions like ANRF and the RDI Fund are strengthening R&D, while PM GatiShakti and industrial corridors are improving infrastructure and logistics to enhance cost competitiveness.
- The path to Viksit Bharat @2047 requires strategic resilience and continuous ascent within the GVCs. Sustained reforms across five pillars—Ease of Doing Business, R&D and innovation, Skilling, Infrastructure & Logistics, and Scaling up of MSMEs—will remain critical in positioning industry as a key engine of future growth.
Chapter Precap
Global Manufacturing Landscape
| Domestic Industrial Performance
|
Industrial Strengths and Core Sectors
| Employment, MSMEs, and Innovation
|
Policy Support and Infrastructure
| Global Integration and Future Roadmap
|
Global Manufacturing: Uneven Recovery and the Shift towards High-Tech Value Chains
- In 2025, the global industrial sector continued to face macroeconomic challenges due to geopolitical shifts, inflationary pressures, and supply chain realignments. Despite a stable first half, the overall outlook remains subdued with downside risks.
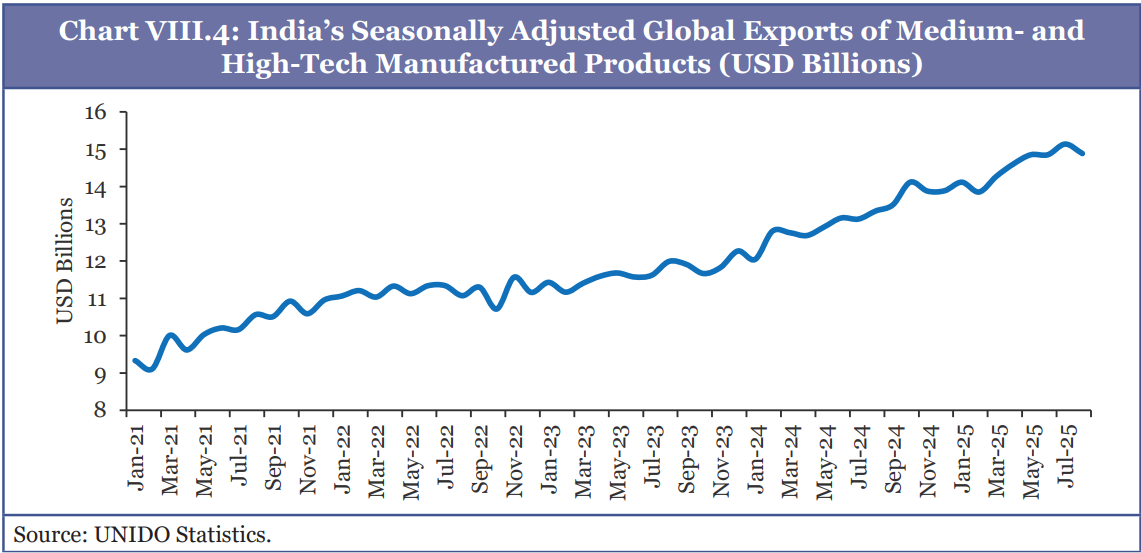
- Global manufacturing is increasingly shifting towards high-value, innovation-intensive activities.
- Future success will depend on a country's ability to integrate into Global Value Chains (GVCs) as a high-tech, high-productivity manufacturing hub supported by stable policies.
Domestic Developments: Resilience and Structural Transformation
- India's industrial performance remains strong, with Industry Gross Value Added (GVA) growing by 7.0 per cent year-on-year in real terms in the first half of FY 2025–26, up from 5.9 per cent in FY 2024–25.
- Medium- and high-technology activities now account for 46.3 per cent of India's total manufacturing value added, placing India among a small group of middle-income economies moving towards more sophisticated production structures.
- Given its strategic importance, employment potential, and economic linkages, Industrial sector requires focused reforms across five pillars: ease of doing business, innovation and R&D, skill development, infrastructure and logistics, and scaling up MSMEs for global competitiveness.
Core Input Industries
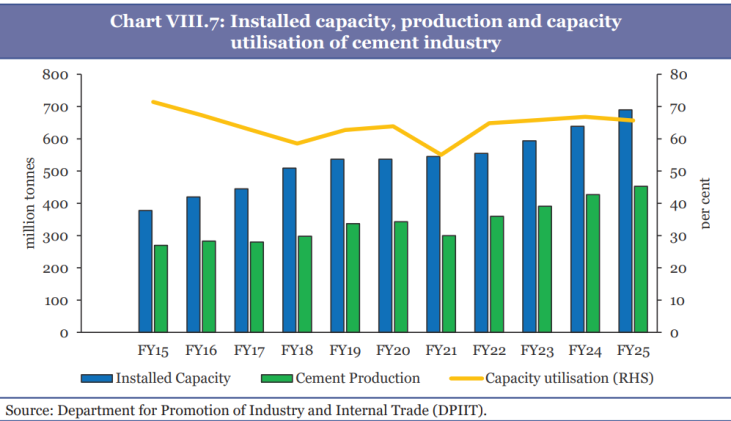
Cement
- India is the second-largest cement producer in the world after China.
- Most cement plants in India are located near raw material sources, with about 85 per cent of the industry concentrated in Rajasthan, Andhra Pradesh, Telangana, Karnataka, Madhya Pradesh, Gujarat, Tamil Nadu, Maharashtra, Uttar Pradesh, Chhattisgarh, and West Bengal.
- Per capita cement consumption in India is about 290 kg, lower than the global average of 540 kg.
- Government's focus on mega infrastructure projects such as highways, railways, housing schemes, smart cities etc. is expected to fuel cement demand significantly.
Steel
- The steel sector underpins industrialisation and infrastructure, positioning India as the world's second-largest crude steel producer.
- The sector faces challenges from international price disparities and raw material security. In FY 2025–26 (April–October), India became net steel importer due to low global prices, weaker export margins, and cheaper imports.
- While self-sufficient in iron ore, the industry remains heavily dependent on imported coking coal.
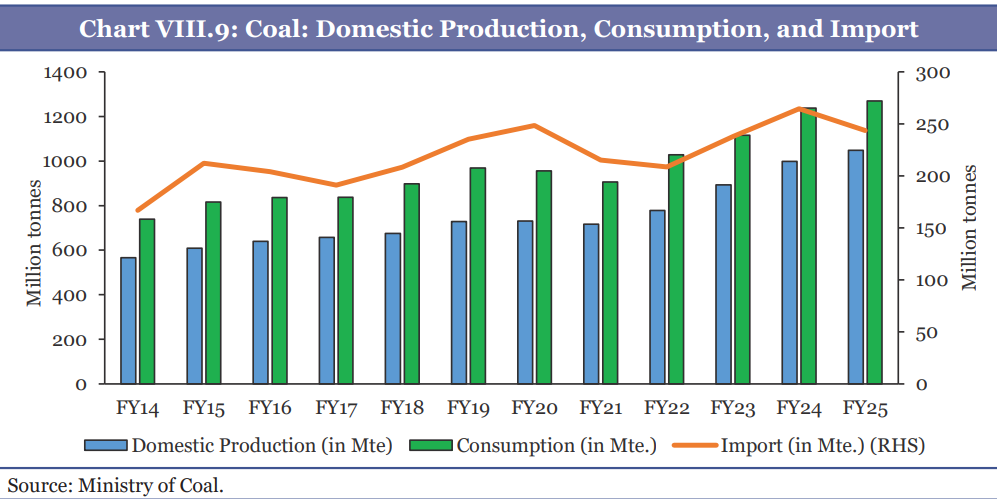
Coal
- With the world's fifth-largest coal reserves and as the second-largest consumer, coal remains vital, contributing 55 per cent to the energy mix and over 74 per cent of power generation.
- India's coal production reached a record 1,047.52 million tonnes in FY 2024–25, a 4.98 per cent increase from 997.83 million tonnes the previous year, highlighting the sector's strong growth and importance to energy security.
Chemicals & Petrochemicals
- The sector contributed 8.1 per cent to the overall manufacturing sector's GVA in FY24.
- The total production of Major Chemicals and Petrochemicals registered a Compound Annual Growth Rate (CAGR) of 2.8 per cent during the period FY16 to FY25.
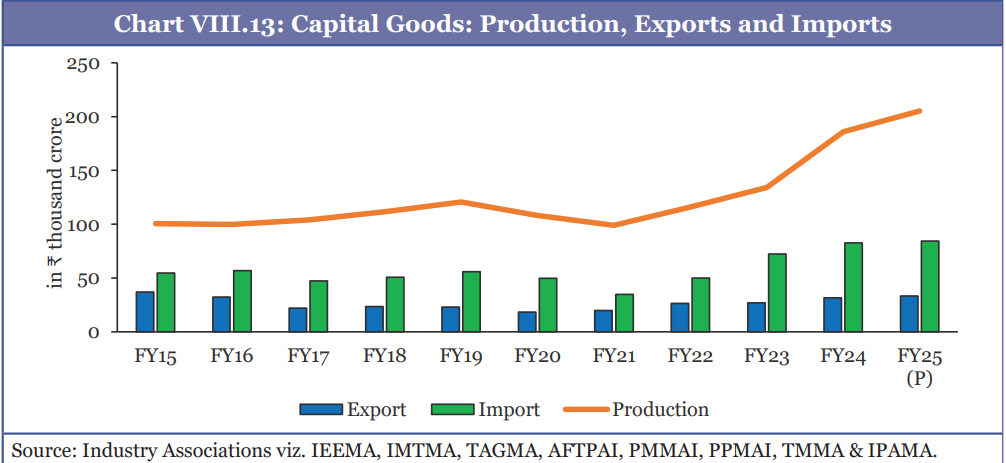
Performance of Capital Goods and Consumer Goods Industries
Automobiles
- India is the third-largest market for passenger and commercial vehicles.
- Production grew by nearly 33 per cent from FY15 to FY25.
- EV registrations grew at a CAGR of 62.5 per cent.
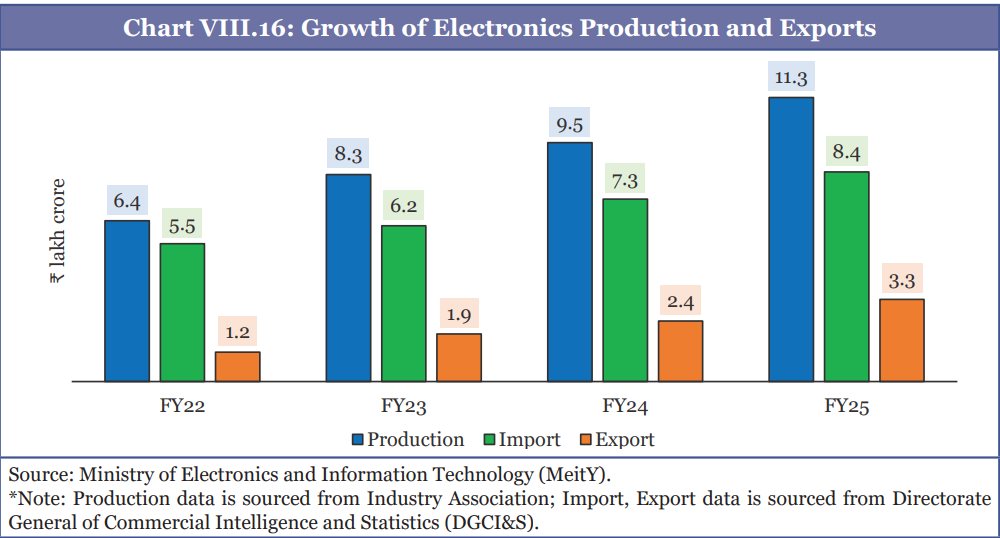
Electronics
- This sector transformed from the 7th largest export in FY22 to the 3rd largest in FY25.
- Exports reached USD 22.2 billion in H1 FY26.
- Mobile phone production value surged 30-fold from ₹18,000 crore in FY15 to ₹5.45 lakh crore in FY25, making India second-largest mobile manufacturer globally.
Pharmaceuticals
- India's pharmaceutical industry is the world's third-largest by volume, supplying about 20% of global generic medicines and exporting to 191 countries in FY25.
- India's medical devices sector is rapidly gaining global competitiveness, exporting to 187 countries in FY25.
- India currently ranks 11th globally in pharmaceutical exports by value, with a 3 per cent share.
Textiles
- India's apparel and textile industry, valued at about USD 179 billion, contributes nearly 2% to GDP and around 11% to manufacturing GVA.
- India is the world's sixth-largest exporter of textiles and apparel, holding about a 4% global share.
- Exports, including handicrafts, rose to USD 37.75 billion in FY25 from USD 35.87 billion in FY24.
- Sector faces challenges such as, small scale and fragmentation of the value chain, heavy reliance on cotton, limited FDI and technology adoption.
Key Initiatives to Promote Manufacturing
- PLI Scheme: Covering 14 sectors with an outlay of ₹1.97 lakh crore, the scheme has realized actual investments of over ₹2.0 lakh crore, incremental production of over ₹18.70 lakh crore, and employment generation of over 12.60 lakh till September 2025.
- National Manufacturing Mission (NMM): Announced in Budget 2025-26, aiming to double manufacturing's GDP share to 25 per cent and generate 143 million jobs by 2035.
Innovation, R&D, and Quality Control
Global Standing
- India ranks 3rd globally in scientific research publications, 4th in trademarks, and 6th in patents (2024).
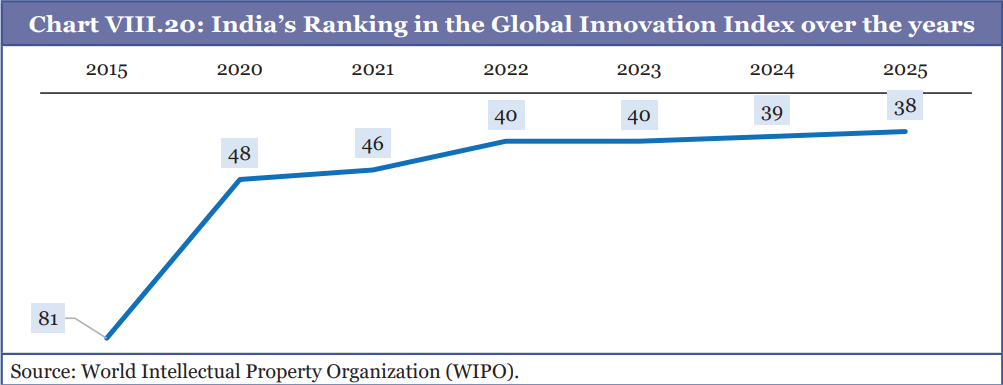
- The Global Innovation Index ranking improved to 38th in 2025.
Startups
- DPIIT-recognised startups grew to 1.57 lakh by 2024.
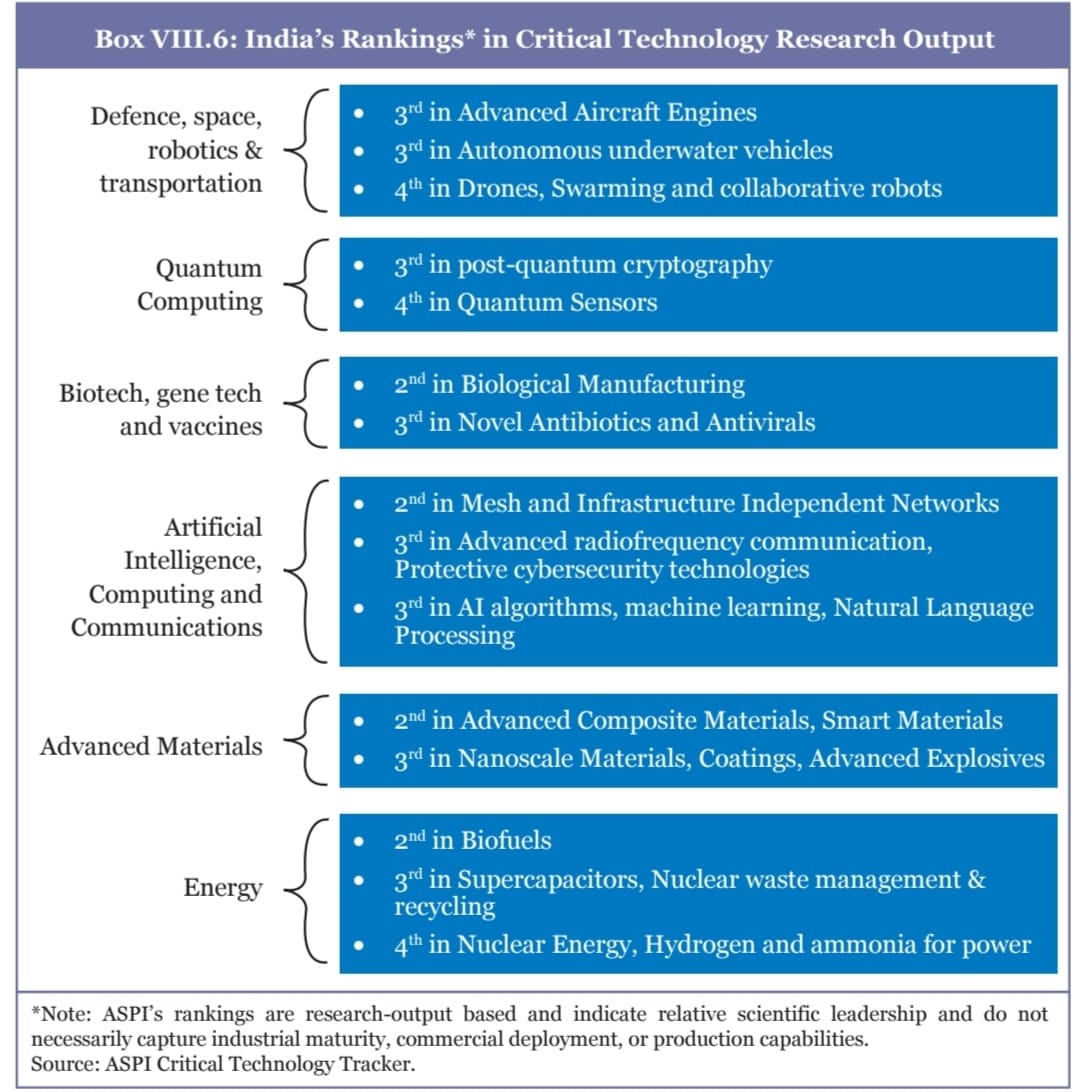
- India ranks among the top five countries in 45 out of 64 critical technologies.
R&D Investment
- India's Gross Expenditure on R&D stands at 0.64% of GDP, well below the global average and far lower than major economies such as the US (3.48%), China (2.43%), and South Korea (4.91%).
- Low R&D spending in India is partly due to weak business investment, which accounts for only 41% of total expenditure, compared with much higher shares in China (77%), the US (75%), and South Korea (79%).
- India excels at Technology Readiness Level (TRL) 1-3, but an industrial economy needs TRL 7-9 products. The intermediate stage - prototyping, piloting, and characterisation - constitutes the stage at which Indian innovation appears to stagnate
- India has strengthened its R&D ecosystem through the ANRF Act, 2023, supported by national missions (National Quantum Mission, IndiaAI Mission, the India Semiconductor Mission etc.) and a ₹1 lakh crore RDI Fund, to boost innovation, private investment, and technological leadership.
Industrial Clusters – Why India Must Upgrade Strategy:
|
Infrastructure and Logistics
- Logistics Efficiency: Logistics costs are estimated at 7.97 per cent of GDP for FY24, down from 8.84 per cent in FY23, driven by PM GatiShakti and National Logistics Policy.
- Industrial Corridors: The National Industrial Corridor Development Programme has operationalised cities like Dholera and Shendra-Bidkin with ₹2.02 lakh crore investments.
- Regional Growth: Manufacturing is expanding into Tier-2 and Tier-3 cities (e.g., Hubballi-Dharwad, Belagavi), leveraging lower costs and improved connectivity.
Scaling Up MSMEs
- Significance: MSMEs account for 35.4 per cent of manufacturing output, 48.58 per cent of exports, and 31.1 per cent of GDP, employing over 32.82 crore people.
- Credit and Finance: Despite wider credit reach and growing digital integration, many micro-enterprises still face limited access to formal finance.
- SME public markets have expanded rapidly in the past two years, driven by strong market conditions and rising digital retail participation, with IPO listings rising by 87.2% between 2022–23 and 2024–25.
- Support Measures: Credit support and promotion initiatives include the Credit Guarantee Scheme for Micro and Small Enterprises (MSEs), the Self-Reliant India (SRI) Fund, the Prime Minister's Employment Generation Programme (PMEGP), the "Zero Defect, Zero Effect" quality framework and the TEAM (Trade Enablement and Marketing) Initiative.
Integrating with Global Value Chains (GVCs)
- Limited Global Manufacturing Presence: India's share of global manufacturing GVA (2.9%) and merchandise exports (1.8%) in 2024 remains modest, reflecting untapped potential and low participation in global value chains.
- Need for Greater GVC Integration: For a labour-rich economy like India, deeper GVC participation through imported inputs boosts domestic value addition and employment in the medium term, supporting higher-productivity job creation.
- Opportunities from Global Supply Chain Shifts: Geopolitical realignments and supply-chain restructuring create new opportunities for India to emerge as a competitive assembly and manufacturing hub in global networks.
- Impact of Inverted Duty Structures: Higher import tariffs on intermediates and capital goods than on final products result in inverted duty structures, increasing input costs and discouraging domestic manufacturing.
- Role of Tariff Rationalisation: Continued tariff calibration on intermediates and capital goods can improve cost competitiveness, strengthen component ecosystems, and support India's emergence as a global production base.
Conclusion: A Roadmap for the Next Leap
- Shift towards Competitiveness and Global Integration: The next phase of industrialisation requires moving beyond import substitution towards scale, competitiveness, innovation, and deeper integration with global value chains. Strategic resilience through diversification and capability building is essential.
- Strategic Role of Manufacturing: Manufacturing must be treated as a strategic national asset, central to employment, productivity, exports, and resilience. A mission-oriented approach, including selective government support, is needed beyond incentive-based policies.
- MSMEs as Growth Anchors: MSMEs are vital to industrial transformation and must evolve from micro-scale operations to active participation in formal and export-oriented supply chains through technology, skills, and quality systems.
- Expanded Role of the State: The State must act as strategist, coordinator, risk absorber, and capability builder, working within a federal framework where States align national priorities with local strengths.
- Innovation and Workforce Readiness: Support through ANRF and the RDI Fund, along with skilled manpower in semiconductors, EVs, green technologies, and advanced materials, will drive technological upgradation.
- Industrial Growth for Viksit Bharat@2047: Sustained reforms, investment in innovation and human capital, and dynamic private sector participation can make the industrial sector a central pillar in India's journey towards Viksit Bharat@2047.
What does the Budget Say?
- Scaling up manufacturing in strategic sectors: Budget prioritises 7 strategic and frontier sectors including biopharma, semiconductors, electronics components, rare earth magnets, chemicals, capital goods, and textiles.
- Capital goods capability enhancement: Budget proposes hi-tech tool rooms,Construction and Infrastructure Equipment (CIE) scheme & container manufacturing scheme to strengthen high-value manufacturing capacity.
- Electronics ecosystem support: Outlay for Electronics Components Manufacturing Scheme has been increased.
- Champion MSMEs: A ₹10,000 crore SME Growth Fund has been introduced to promote high-growth MSMEs, along with a ₹2,000 crore top-up to the Self-Reliant India Fund to improve access to risk capital.
- Rejuvenating industrial clusters: A scheme has been proposed to revive 200 legacy industrial clusters.
- Infrastructure push: Public capital expenditure has been raised to ₹12.2 lakh crore to accelerate infrastructure development, boosting demand for capital goods and manufacturing inputs.
- Textiles and allied sectors: An integrated textiles programme has been announced covering natural fibres, cluster modernisation, skill development, and establishment of Mega Textile Parks.
- Ease of doing business and investment reforms: Reforms have been proposed to simplify foreign investment norms, rationalise customs duties, and reduce compliance burden for industry.
Glossary
Terms | Meanings |
| Global Value Chains (GVCs) | GVCs refer to international production networks in which different stages of manufacturing and services are located across multiple countries. |
| Production Linked Incentive (PLI) Scheme | The PLI Scheme provides financial incentives to firms based on incremental production to promote domestic manufacturing and exports. |
| Industry Gross Value Added (GVA) | Industry GVA is the value of output generated by the industrial sector after deducting intermediate consumption, measured in real terms. |
| Medium- and High-Technology Manufacturing | These refer to manufacturing activities that involve advanced technology, higher R&D intensity, and greater value addition. |
| Anusandhan National Research Foundation (ANRF) | ANRF is a statutory body established under the ANRF Act, 2023 to strengthen India's research and innovation ecosystem through strategic funding and coordination. |
| Research, Development and Innovation (RDI) Fund | The RDI Fund is a dedicated financial mechanism to support private sector-led research, innovation, and technological development. |
| Logistics Cost | Logistics cost refers to the total expenditure incurred on transportation, warehousing, and supply chain management as a percentage of GDP. |
| Inverted Duty Structure | An inverted duty structure occurs when import duties on intermediate inputs are higher than those on finished goods, reducing domestic competitiveness. |
| Gross Expenditure on R&D (GERD) | GERD represents total national spending on research and development as a percentage of GDP. |
| Industrial Corridors | Industrial corridors are planned industrial regions with advanced infrastructure, logistics, and connectivity to promote manufacturing clusters. |
Mains Questions
1. Despite ranking third globally in scientific research publications and hosting a vibrant startup ecosystem, India's industrial R&D expenditure remains suboptimal. Critically examine the structural bottlenecks in India's innovation landscape and discuss how the Anusandhan National Research Foundation (ANRF) aims to address them.
2. Discuss the role of MSMEs and Global Value Chains in achieving the vision of Viksit Bharat@2047. Highlight key challenges and policy responses.


