
Introduction
- The world is moving from seamless globalisation to bilateralism and protectionism where national security, technological sovereignty, and strategic autonomy drive trade and investment.
- India's external sector has shown resilience with record exports, resilient service trade and a stable current account, despite global volatility.
Chapter Precap
Global Trade Dynamics
| India's performance
|
India's Balance of Payments
| |
Global Trade Dynamics
- Rising trade Uncertainty: The global order faces trade policy uncertainty, strategic decoupling, and the weaponization of trade policy for national security.
- E.g. Trade Policy Uncertainty and Global Economic Policy Uncertainty (GEPU) indices peaked in April 2025 due to weakening multilateral and regional trade agreements, pursuit of sovereign interest and competition for rare earth minerals. (UNCTAD, 2025)
- Global Trade Policy Activity Index which shows tendency to use trade policy for broader objectives has been rising since 2020 due to tension between China and US, etc.
- This has led to the rise of minilateral platforms, such as the Indo-Pacific Economic Framework for Prosperity.
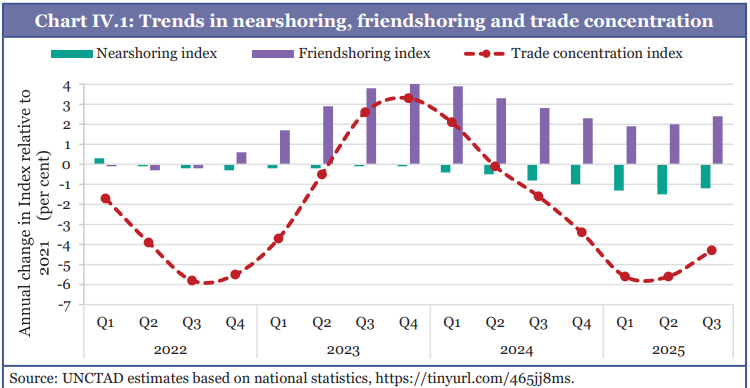
- Geostrategic Globalisation: Supply chains are being reconfigured based on strategic autonomy esp. in critical sectors. E.g., Semiconductor, telecom, Pharma,
- Mechanisms like friend shoring, nearshoring and Trade concentration are gaining traction.
Trade Performance
- Trade projections: According to IMF's World Economic Outlook, Global trade volume is projected to increase in 2025 to 3.6% and then slow to 2.3% in 2026.
- Advance trade orders in anticipation of higher tariffs led to a significant increase in trade in CY 2025.
- Divergence between Advanced and Emerging Economies: While EMDEs (Emerging Market and Developing Economies) have higher growth forecasts than Advanced Economies (AEs), they are more vulnerable to trade policy uncertainty.
Trends in India's Trade Performance
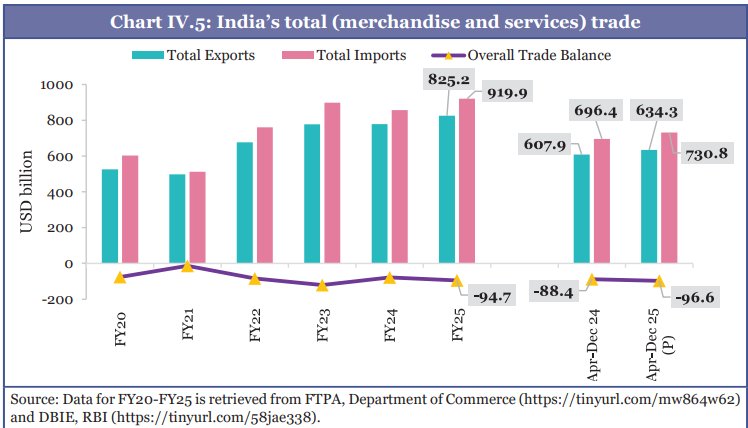
- Overall Growth: India's total exports reached a record $825.3 billion in FY25 (6.1% growth), driven by services (13.6 % growth) and non-petroleum merchandise
- Imports also increased by 7.4% YoY to $919.9 bn.
- Rise as a key player in global trade is evident by increasing share of both global merchandise exports and commercial services exports. Between 2005 and 2024
- Share of global merchandise exports has nearly doubled, rising from 1 % to 1.8%.
- Share in global commercial services exports has almost doubled, from 2% to 4.3 %.
- Diversification: India ranks 3rd in the Global South (following China and UAE) for trade partnership diversity, - UNCTAD's Trade and Development Report 2025
- India's index score of 3.2 exceeds that of all countries in the Global North indicating resilience against specific market shocks.
- In terms of the merchandise trade diversity indicator, India ranks 4th in the Global South (index score of 0.88). While it exceeds several nations it falls behind US, EU etc indicating opportunities for improvement here
- Steps taken to promote Exports
- Trade Connect ePlatform: Provides information on tariff concessions available to eligible exports
- Export Promotion Mission (EPM): Establishes a comprehensive and unified and digitally driven framework for enhancing export initiatives.
- Credit Guarantee Scheme for Exporters: Provides additional financial assistance to Indian exporters during periods of uncertainty
- Relaxation of FEMA Regulations: Under the Foreign Exchange Management (Export of Goods and Services) (Second Amendment) Regulations, 2025, the timeline for the realisation and repatriation of export proceeds has been extended from nine months to 15 months.
Merchandise Trade
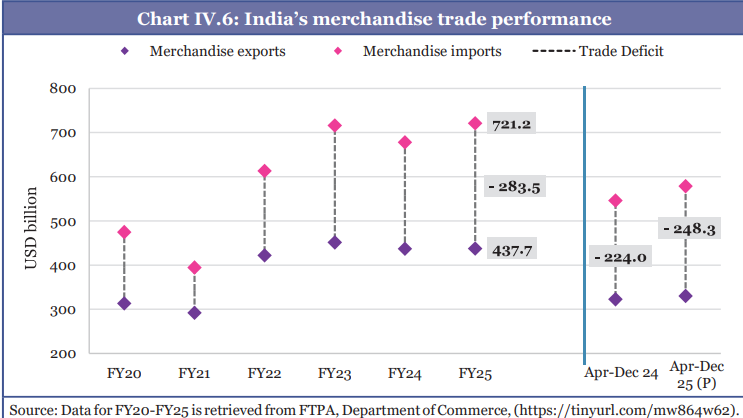
- Exports: $437.7 billion in FY25 (similar to 2024)
- Non-petroleum, non-gems and jewellery exports, accounting for 78.7% of aggregate merchandise exports.
- Stagnation in merchandise exports can largely be attributed to the petroleum and gems and jewellery which masks the favourable trend in broader sectors.
- Exports of telecom instruments, electric machinery also increased.
- Imports: Rose to $721.2 billion, driven by a rise in non-petroleum, non-gems and jewellery imports, electronic components.
- Import continues to be dominated by petroleum crude, gold and petroleum products (these sectors account for 1/3d of the total imports)
- Gold imports increased significantly due to rise in prices.
- Increase in the import of Intermediate products: As India's exports of finished products rise, there is a concomitant increase in the import of intermediate products, implying an improvement in manufacturing abilities
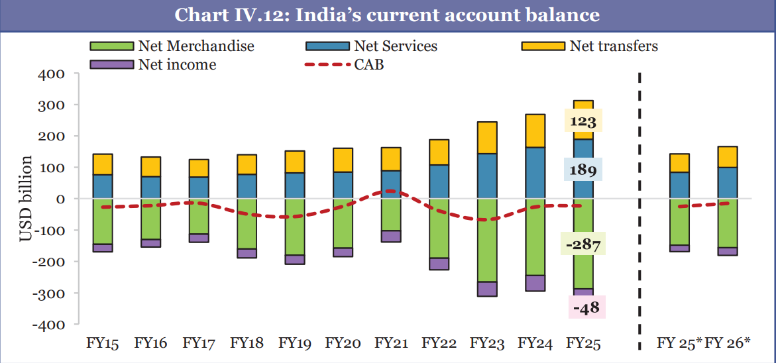
- Merchandise Trade Deficit widened by 17.6% YoY to $283.5 bn in FY25. Services trade surplus cushioned this deficit leading to an overall trade deficit of $94.7 bn.
Performance of Agricultural Exports
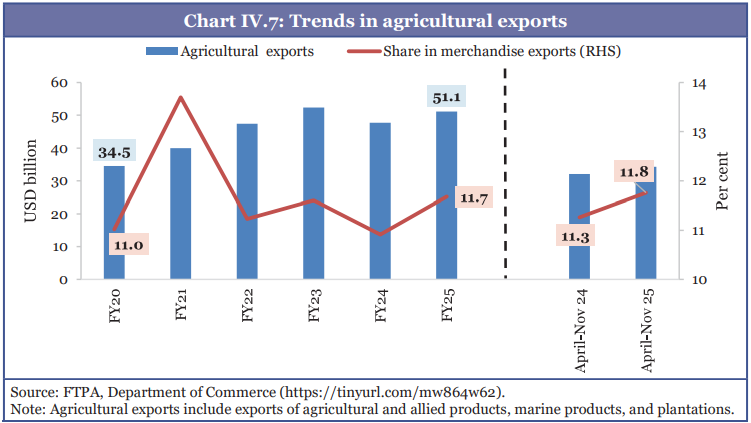
- Status: Despite India being the world's 2nd largest agricultural producer by value, its share in global agricultural exports is only 2.2%. (1.1% in 2000).
- Agricultural exports grew faster than overall merchandise exports over FY20–FY25 to reach USD 51.1 billion in FY25. It has potential to reach $100 bn exports.
- However, they stagnated in recent years despite rising global agricultural trade.
- Its share in merchandise exports have also increased to 11.7%.
- Key Intervention Required:
- Instead of abrupt export bans, subsidised distribution, managing buffer stocks, using the Essential Commodities Act, 1955 to prevent hoarding etc. can be deployed to balance domestic prices and export potential.
Trade Performance of Production-Linked Incentive (PLI) Scheme Sectors
- Introduced to enhance domestic manufacturing and promote exports.
- During FY21-FY25, average annual growth rate of exports from sector under PLI stands at 10.6 % while imports have experienced an AAGR of 12.6 %.
- This indicates that domestic manufacturing is maturing and is also leveraging imported intermediate goods to facilitate higher-value exports.
- Notable examples are electronics, IT hardware, and telecom. The telecom sector achieved notable import substitution.
Case study: Pharmaceutical sector: how industry can reinvent itself in the face of global challenges
|
Diversification of India's export destinations and import sources
- Exports to the US in labour-intensive sectors declined during April-November 2025.
- However, India's overall global exports in these categories remained resilient due to significant pivots toward new destinations in the Middle East, Africa, Europe, and Asia.
- Diversification of Import Sources: India has also diversified crude oil import sources, reducing concentration risks and improving energy security.
- E.g. In FY26 (April-November), crude oil imports from Libya, Egypt, Brazil, the US and Brunei increased YoY, while from Russia, Saudi Arabia, etc. declined.
- Potential of Free Trade Agreements (FTAs): To further diversify India has signed various bilateral trade agreements.
- E.g., India-UK Comprehensive Economic and Trade Agreement , India-Oman Comprehensive Economic and Partnership Agreement (CEPA)
- Potential for Improvement in Export Basket:
- Current Concentration and Complexity: India's export composition remains heavily concentrated in goods that fall into low- and mid-complexity categories
- India ranked 44th on the Economic Complexity Index in 2023 (how diversified and complex their export basket is), unchanged since 2019.
- This highlights the need to shift towards high-complexity exports such as advanced machinery, electronics, chemicals and high-value services.
- The gap between India's ECI rank and its 2nd highest rank on the Economic Complexity Outlook Index (evaluates future potential to diversify into more sophisticated products) reveals underutilised productive potential.
- To fulfil this potential we need to ensure quality at scale, strengthen R&D and innovation and manufacturing ecosystem.
- Steps taken: Government has introduced Anusandhan National Research Foundation and the Research, Development & Innovation Fund, complemented by initiatives such as the PLI schemes.
- Current Concentration and Complexity: India's export composition remains heavily concentrated in goods that fall into low- and mid-complexity categories
Services trade
- Record Exports: Increased by 13.6% (YoY) to hit an all-time high of $387.5 bn in FY25, with a record surplus of $ 188.8 bn, financing 2/3d of the merchandise trade deficit.
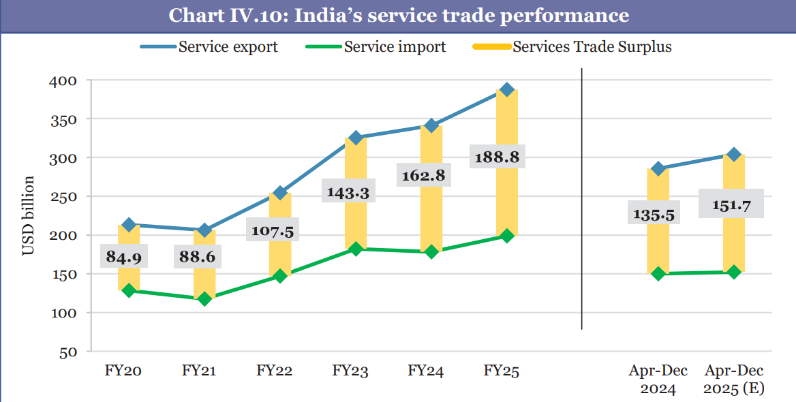
- Key Drivers: software services (largest part of service exports), business and IT services exports and rapid expansion of Global Capability Centres (GCCs).
- India is 2nd in AI skill penetration, behind US - Stanford's AI Index Report 2025
- Though US is largest destination for software exports from India, its share has decreased and is being replaced by EU.
- Services imports also increased by 11.4% (YoY).
India's Balance of Payments
Current Account
- Current Account Deficit (CAD): It moderated to 0.8% of GDP in H1 FY26.
- Remittances: India remains the world's largest recipient of remittances (increased consistently to $135.4 bn i.e. 3.5% of GDP in FY25).
- Structural and Geographic Shifts: Sources are shifting from Gulf countries to Advanced Economies like the US and UK, reflecting a move towards high-skilled migration.
- US (27.7%) is the top contributor followed by UAE, UK and Singapore
- In recent years they have surpassed gross FDI inflows.
Capital Account
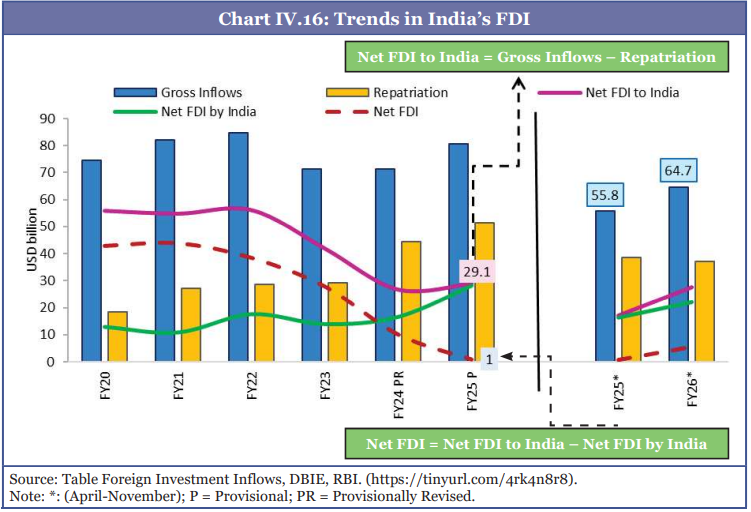
Foreign Direct Investment (FDI)
- Status: India remained a top recipient of Greenfield digital FDI (2020-24).
- Gross FDI inflows rose to $81.0 bn in FY25.
- Of the Total FDI inflows, equity inflows accounted for $51 bn in FY25.
- Sectoral and Digital Dominance: Approximately 60 % of equity inflows in FY25 were directed toward services, computer software and hardware, trading, non-conventional energy, construction, and the automobile sector
- In Greenfield investment, it ranked 4th in 2024.
- India is the largest recipient of gross inflows in South Asia.
- Return on investment: India's average return on inward FDI is approximately 7.3 %, higher than that of some major emerging economies, such as Brazil etc.
- Risk adjusted return: India ranks 2nd only to Indonesia among the major economies like US, Germany etc.
- Net FDI slowed down indicating the profitability of the investments (dividends and profit repatriation) and impact of Overseas Direct Investment (ODI)
India's FDI Challenge: Turning success into sustainable growth
Way ahead for India
|
- Outward Foreign Direct Investment (FDI)
- Status: Outward investment for India increased from FY24 to $23.6 bn in FY25.
- India's top destination countries include Singapore, US, and UAE.
- ODIs reduce net FDI, but supports internationalisation of Indian enterprises enabling them to compete and strengthen the Indian economy in the long term.
- They benefit economy by boosting financial returns through repatriated profits, getting access to new technologies, managerial know-how etc.
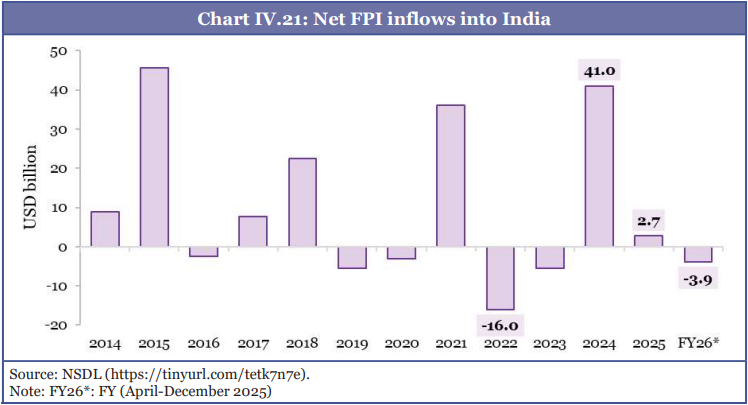
Foreign Portfolio Investments (FPI)
- FPI remained volatile, influenced by global interest rates and risk sentiment rather than domestic factors.
- E.g., Interest rate hikes in US led to Flight to safety i.e. outflows from India.
- Voluntary Retention Route (VRR) and Fully Accessible Route (FAR) routes have stabilised debt flows, particularly when traditional flows were weak.
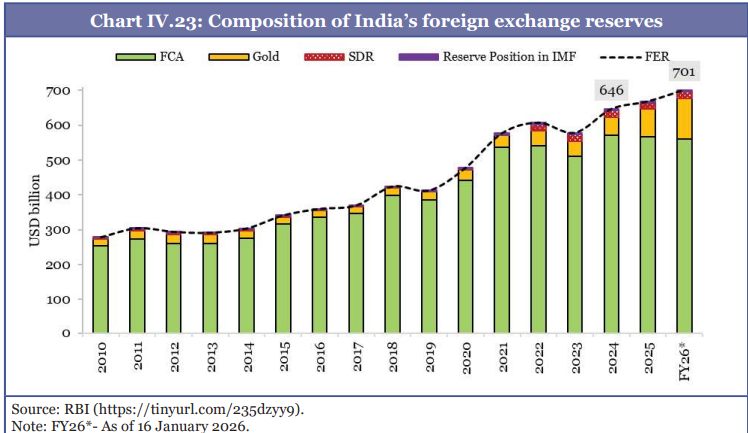
Foreign Exchange Reserves
- It rose to $701.4 bn, covering 11 months of imports, providing a robust buffer against external shocks and about 94 % of the external debt.
- FCA (Foreign Currency Assets) softened while gold rose sharply recently indicating both increase in gold prices and continued diversification by central banks in non $ reserve assets.
- Special drawing rights (SDRs) remained stable India's reserve position in the IMF increased to USD 4.7 billion.
Exchange Rate
- Rupee depreciated by 5.4% against the USD in FY26 (up to Jan), driven by tariff-related measures and capital outflows.
- This made INR one of the most depreciated currencies alongside the Japanese Yen (-5.5).
- CAD and Depreciation: Even though in some years like FY13, higher CAD coincided with sharper rupee depreciation, rising imports doesn't always mean currency depreciation.
- However, widening trade deficits do not always lead to depreciation if they are supported by robust net foreign investment inflows.
- Combined pressure on the exchange rate: Growth-led CAD (high growth leads to high demand resulting in higher imports) + tighter global capital conditions (making It difficult to compensate CAD).
- Long-term anchor of exchange rates: It is determined by savings–investment balance and current account position i.e. Countries with high savings and sustained surpluses see long-term currency strength
- Boosting Manufacturing exports, supported by services. E.g. as done by East Asian economies
- These experiences show that durable currency stems from sustained manufacturing export capacity, not financial openness and macroeconomic signalling alone.
International Investment Position (IIP)
- In 2024, Germany overtook Japan to become the world's largest creditor nation.
- India's Status: India ranked as 11th largest debtor with a negative Net IIP of USD 0.3 trillion.
- However, the international financial assets-to-liabilities ratio improved to 77.5%, indicating strengthening external balance sheets.
- Net IIP as a ratio to GDP improved to -8.7 %, compared to -10.1 % a year ago and -14.1 % five years earlier
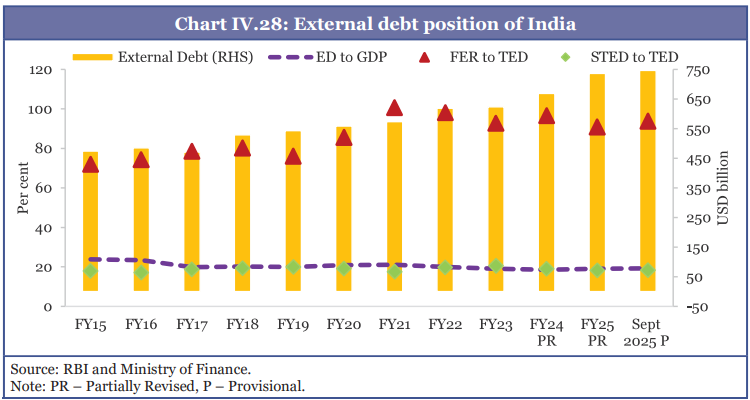
External debt
- India: External debt stood at $ 718.2 billion, a 10.7% increase YoY (end-Dec 2024), with a comfortable external debt-to-GDP ratio of 18.4%, making India one of the least leveraged emerging economies
- India ranked 21st worldwide and 11th within the G20.
- It constitutes less than 5 % of the government of India's total debt.
- Global External Debt Burden: AEs accounted for 88.1% of the total, while EMDEs recorded a faster expansion.
Conclusion and Outlook
- Despite rising global uncertainty, India's external sector is positioned to remain a pillar of macroeconomic stability, supported by services exports, diversification, manufacturing upgrades, and strong external buffers
What does the budget Say?
- Individual Foreign Investors (PROI): Individual PROIs will be permitted to invest in equity instruments via the Portfolio Investment Scheme.
- FEMA Review: A comprehensive review of the Foreign Exchange Management (Non-debt Instruments) Rules is proposed to create a framework that is more contemporary and user-friendly.
- Customs Process Reforms and Trade Facilitation
- Advance Rulings: To provide business certainty, the validity of advance rulings is extended from 3 years to 5 years.
- Digital Clearance: A single, interconnected digital window will process approvals from all agencies (Drug Controller, FSSAI, etc.) by the end of the financial year.
- Customs Integrated System (CIS): It will be rolled out in 2 years as an integrated platform for all the customs processes.
- New Export Opportunities
- Fisheries: Fish catch by Indian vessels in the Exclusive Economic Zone (EEZ) or High Seas will be duty-free. Landing such fish at a foreign port will be treated as an export.
- E-Commerce Exports: To help artisans and MSMEs, the value cap of ₹10 lakh per consignment on courier exports is completely removed.
Glossary
Term | Meaning |
Friend shoring | It involves increased trading with economies with politically aligned stances, |
Near shoring | It measures the geographic proximity of trade relationships and shows whether countries are sourcing from nearby partners or distant ones. |
Trade Concentration | Describes how much of the global trade is concentrated in a small set of countries
|
| Risk Adjusted Return | It is ratio of the 10-year average return on investment to its standard deviation
|
Connector Countries | These nations position themselves as geopolitical "bridges," serving as export platforms for multinational enterprises (MNEs) to bypass trade barriers and tariff walls while accessing third-party markets |
Transfer Pricing | It applies when an Indian company imports goods from its own foreign subsidiary. It ensure that company is not overpricing imports to increase expenditure reduce taxable profit in India. |
Geostrategic Globalisation | In it, countries remain interconnected but exercise greater caution regarding whom they trade with and which partners they depend upon. |
Voluntary Retention Route (VRR) | FPIs invest in Indian debt instruments with the condition that they will retain at least 75% of their investment for a minimum period (currently three years). |
Fully Accessible Route (FAR) | FAR permits FPIs, NRIs, OCIs, and other eligible non-residents to invest without quantitative caps, repatriation limits, or sectoral restrictions in designated G-secs.
|


