
Why in the news?
Recently, the findings of PLFS 2025 covering January, 2025 – December, 2025 were released.
Key Highlights of PLFS, Annual Report 2025
- Stable Labour Force Participation Rate (LFPR): In usual status (ps+ss) for persons of age 15 years and above stood at 59.3% and remained stable compared to 2024.
- 79.1% for Male and 40.0% for female.
- 62.8% for Rural areas and 52.2% for Urban areas.
- Worker Population Ratio (WPR): In usual status (ps+ss) for persons of age 15 years and above estimated as 57.4%.
- 76.6% for Male and for 38.8% female.
- 61.2% for Rural areas and 49.7% for Urban areas.
- Unemployment Rates (UR): In usual status (ps+ss) for persons aged 15 years and above was 3.1% overall.
- 3.1% for both male (marginal decline from 3.3% in 2024) and female.
- 2.4% for Rural areas and 4.8% for Urban areas.
- Main Reason for not being in labour force: Male- 69.8% reported want to continue studies; Female- 44.4% cited childcare/personal commitments in home-making as main reason.
- Youth unemployment (age 15-29 years): Decline in UR in usual status (ps+ss)- 9.9% in 2025 from 10.3% in 2024.
- Unpaid Work Gap: Urban self-employed male worked about 17.5 hours more per week than their female counterpart (12.3 hours per week in rural areas).
- In regular wage/salaried employment and casual labour, male worked approximately 7.9 hours and 6.9 hours more per week, respectively, than female.
- Composition of Employment: The percentage distribution of workers (in usual status) by status in employment indicates a modest shift in 2025.
- Share of self-employment declined from 57.5% in 2024 to 56.2% in 2025.
- Share of regular wage/salaried employment increased from 22.4% to 23.6%.
- The share of workers engaged in casual labour remained broadly stable at around one-fifth of total employment
- Sectoral Contribution: Agriculture accounts for largest share of employment, though decreased from 44.8% in 2024 to 43.0% in 2025.
- Construction saw marginal decrease (12.3% to 12.0%).
- Manufacturing saw an improvement from 11.6% to 12.1%.
- Other services have also recorded an increase (12.2% to 13.1%).
- Improved Earnings: Average earnings in regular wage/salaried employment for male increased 5.8% growth (2024-2025) (7.2% growth for females).
- Education:
- Average number of years in formal education: 10 years for persons aged 15 years and above (male at 10.2 years and female at 9.9 years); 9.8 years for persons 25 years and above.
- Persons with at least secondary education: 67.8% in age group 15 years and above.
- Formal vocational/ technical training: 4.2% among persons aged 15-59 years, 5% in group 15-29 years.
- Percentage of persons not in employment, education or training (NEET): In usual status (ps+ss) 24.9% for age group 15-59 years and 21.0% persons in the age group 15-24 years.
About PLFS
- Origin: 2017
- Conducted by: National Statistics Office (NSO), Ministry of Statistics and Programme Implementation (MoSPI).
- Significance: Primary source of statistics on labour force, activity participation of population and structure of employment and unemployment in country.
- Revamped Methodology: It was revamped from January 2025, with key changes like- shifting survey period of PLFS from July-June cycle (agricultural year) to January-December cycle (calendar year) and changes in Sample Design
- Hence, Annual Report, PLFS 2025, is the first comprehensive report based on calendar year (January 2025-December 2025) as survey period.
- Purpose of Revamping:
- Estimate key employment and unemployment indicators (viz. LFPR, WPR, UR) on a monthly basis for rural and urban areas in Current Weekly Status (CWS) at all-India level.
- Extend coverage of Quarterly results of PLFS to rural areas and producing quarterly estimates covering both rural and urban areas in CWS.
- Estimate important employment and unemployment indicators in both usual status (ps+ss) and CWS for rural and urban areas annually.
Definition of Key Terms in PLFS
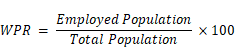
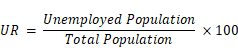
|
Conclusion
The PLFS Annual Report 2025 highlights a resilient Indian labor market, marked by a gradual shift toward formal, salaried positions and a healthy reduction in absolute agricultural dependence. However, moving past headline metrics reveals persistent structural imbalances, including a high youth NEET rate, significant vocational skill deficits, etc.